0. 引言
Dr. Elephant 由 LinkedIn 于 2016 年 4 月份开源,是一个 Hadoop 和 Spark 的性能监控和调优工具。Dr. Elephant 能自动化收集所有指标,进行数据分析,并以简单易用的方式进行呈现。Dr. Elephant 的目标是提高开发人员的开发效率和增加集群任务调试的高效性。Dr. Elephant 支持对 Hadoop 和 Spark 任务进行可插拔式、配置化以及基于规则的启发式job性能分析,并且根据分析结果给出合适的建议来指导如何调优使任务更有效率。
1. 概览
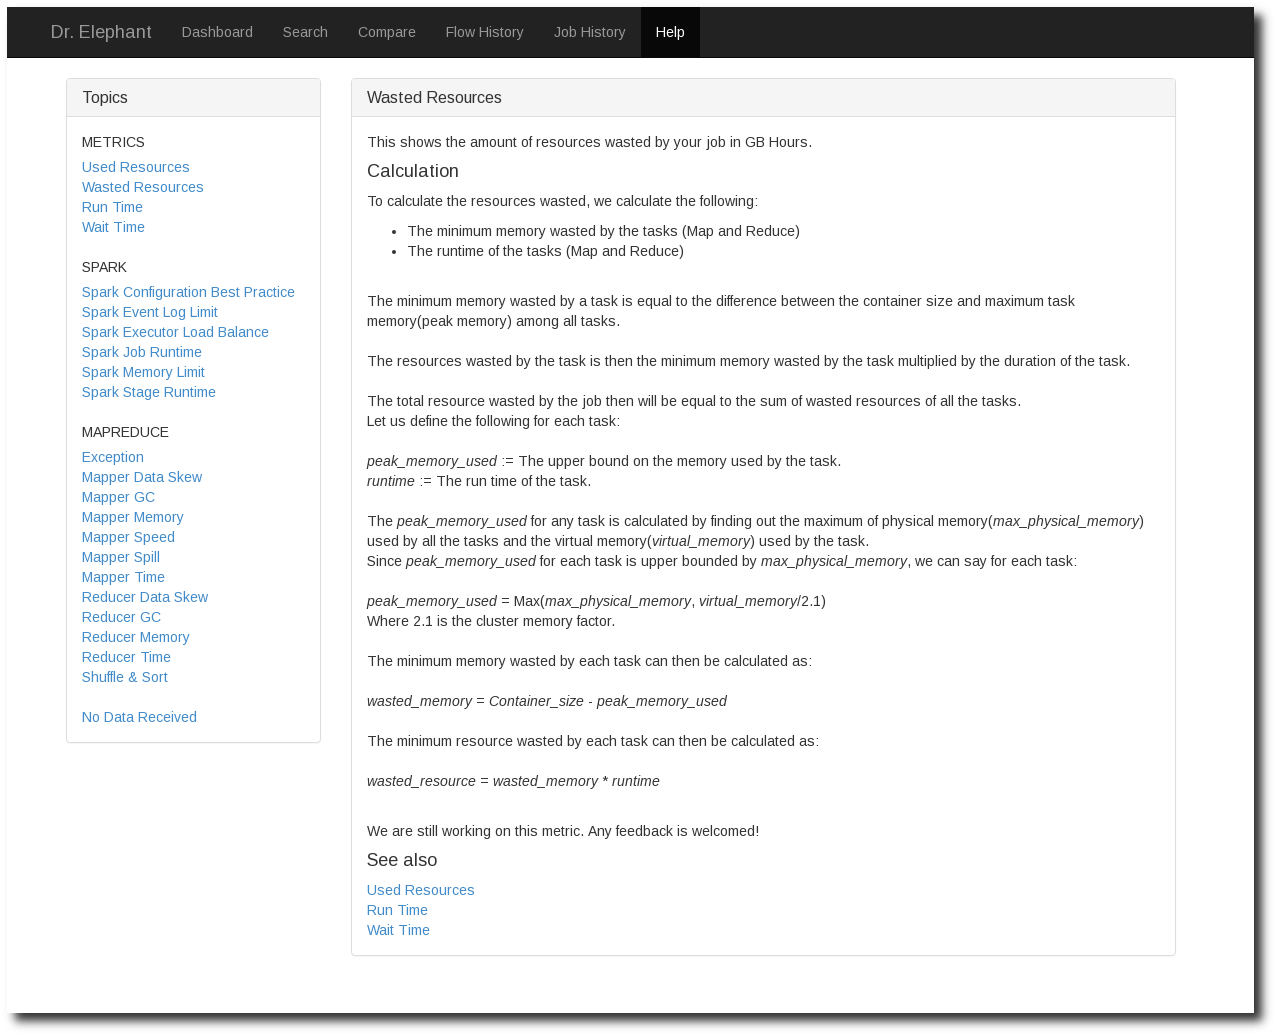
下面是 Dr.Elephant 的界面展示。
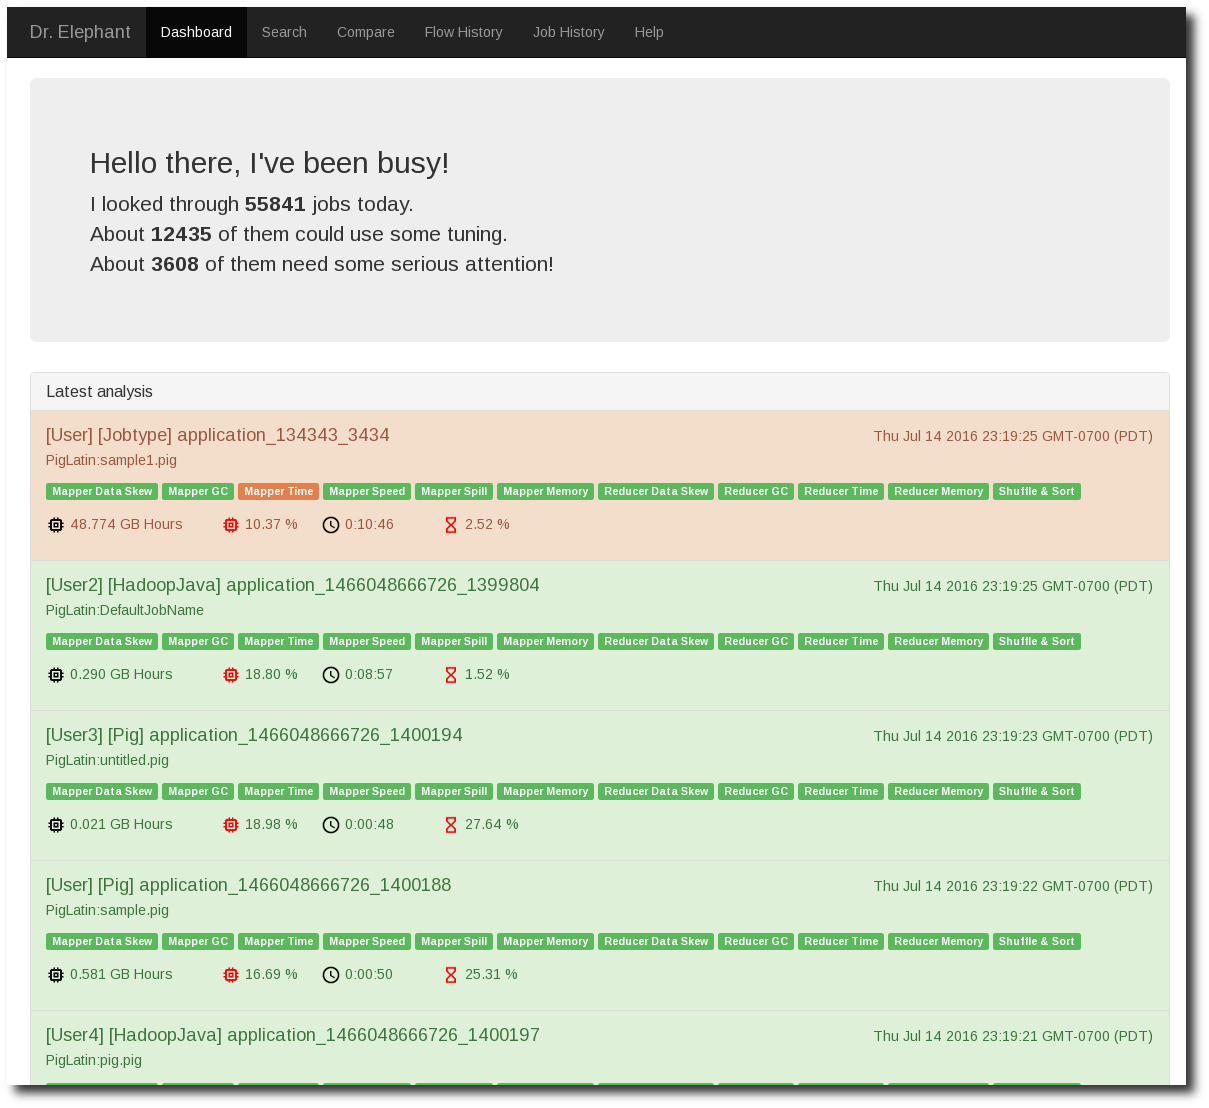
Dashboard 按时间的由近到远展示出 Job 的诊断结果。下面的 Tab:Mapper Data Skew 等都对应到一条规则。蓝色表示规则诊断通过,其他颜色表示有问题。 Dr.Elephant 将诊断结果做了分级,分别对应不同的颜色。
- NONE: 不需要优化
- LOW: 有很小的优化空间
- MODERATE: 有优化空间
- SEVERE: 有更多的优化空间
- CRITICAL: 很有问题,必须优化
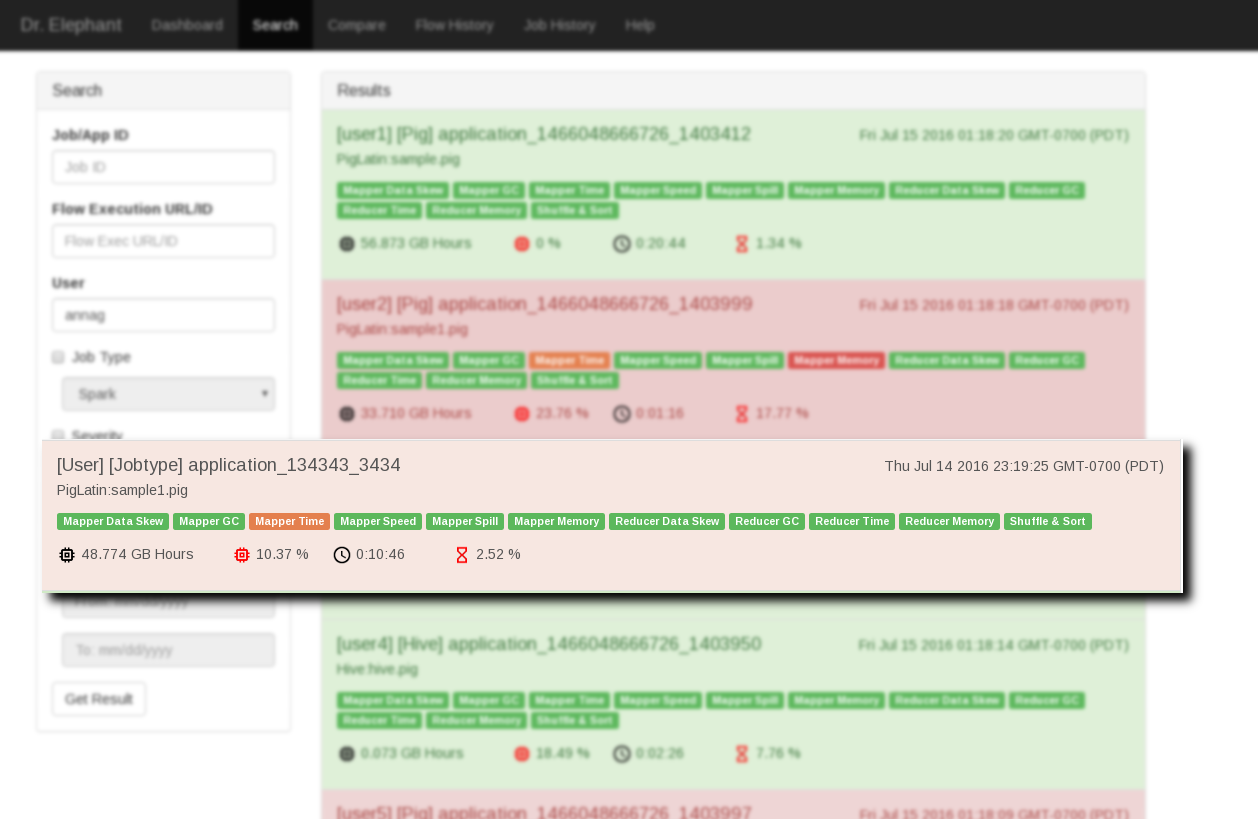
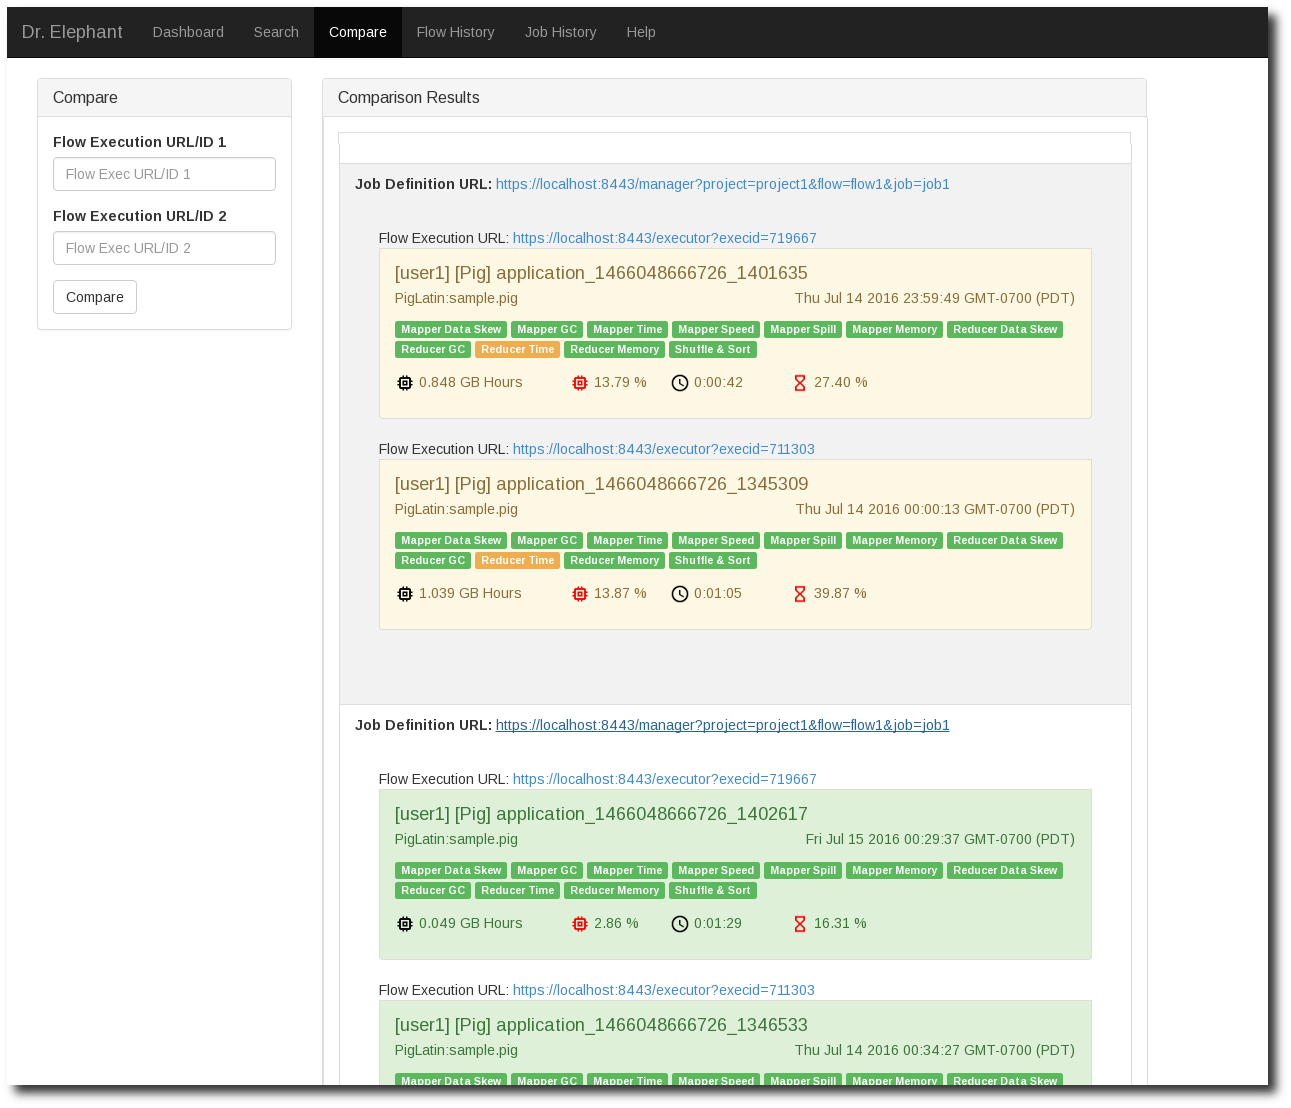
Dr.Elephant 还提供了 job 的搜索和比较,界面如下图
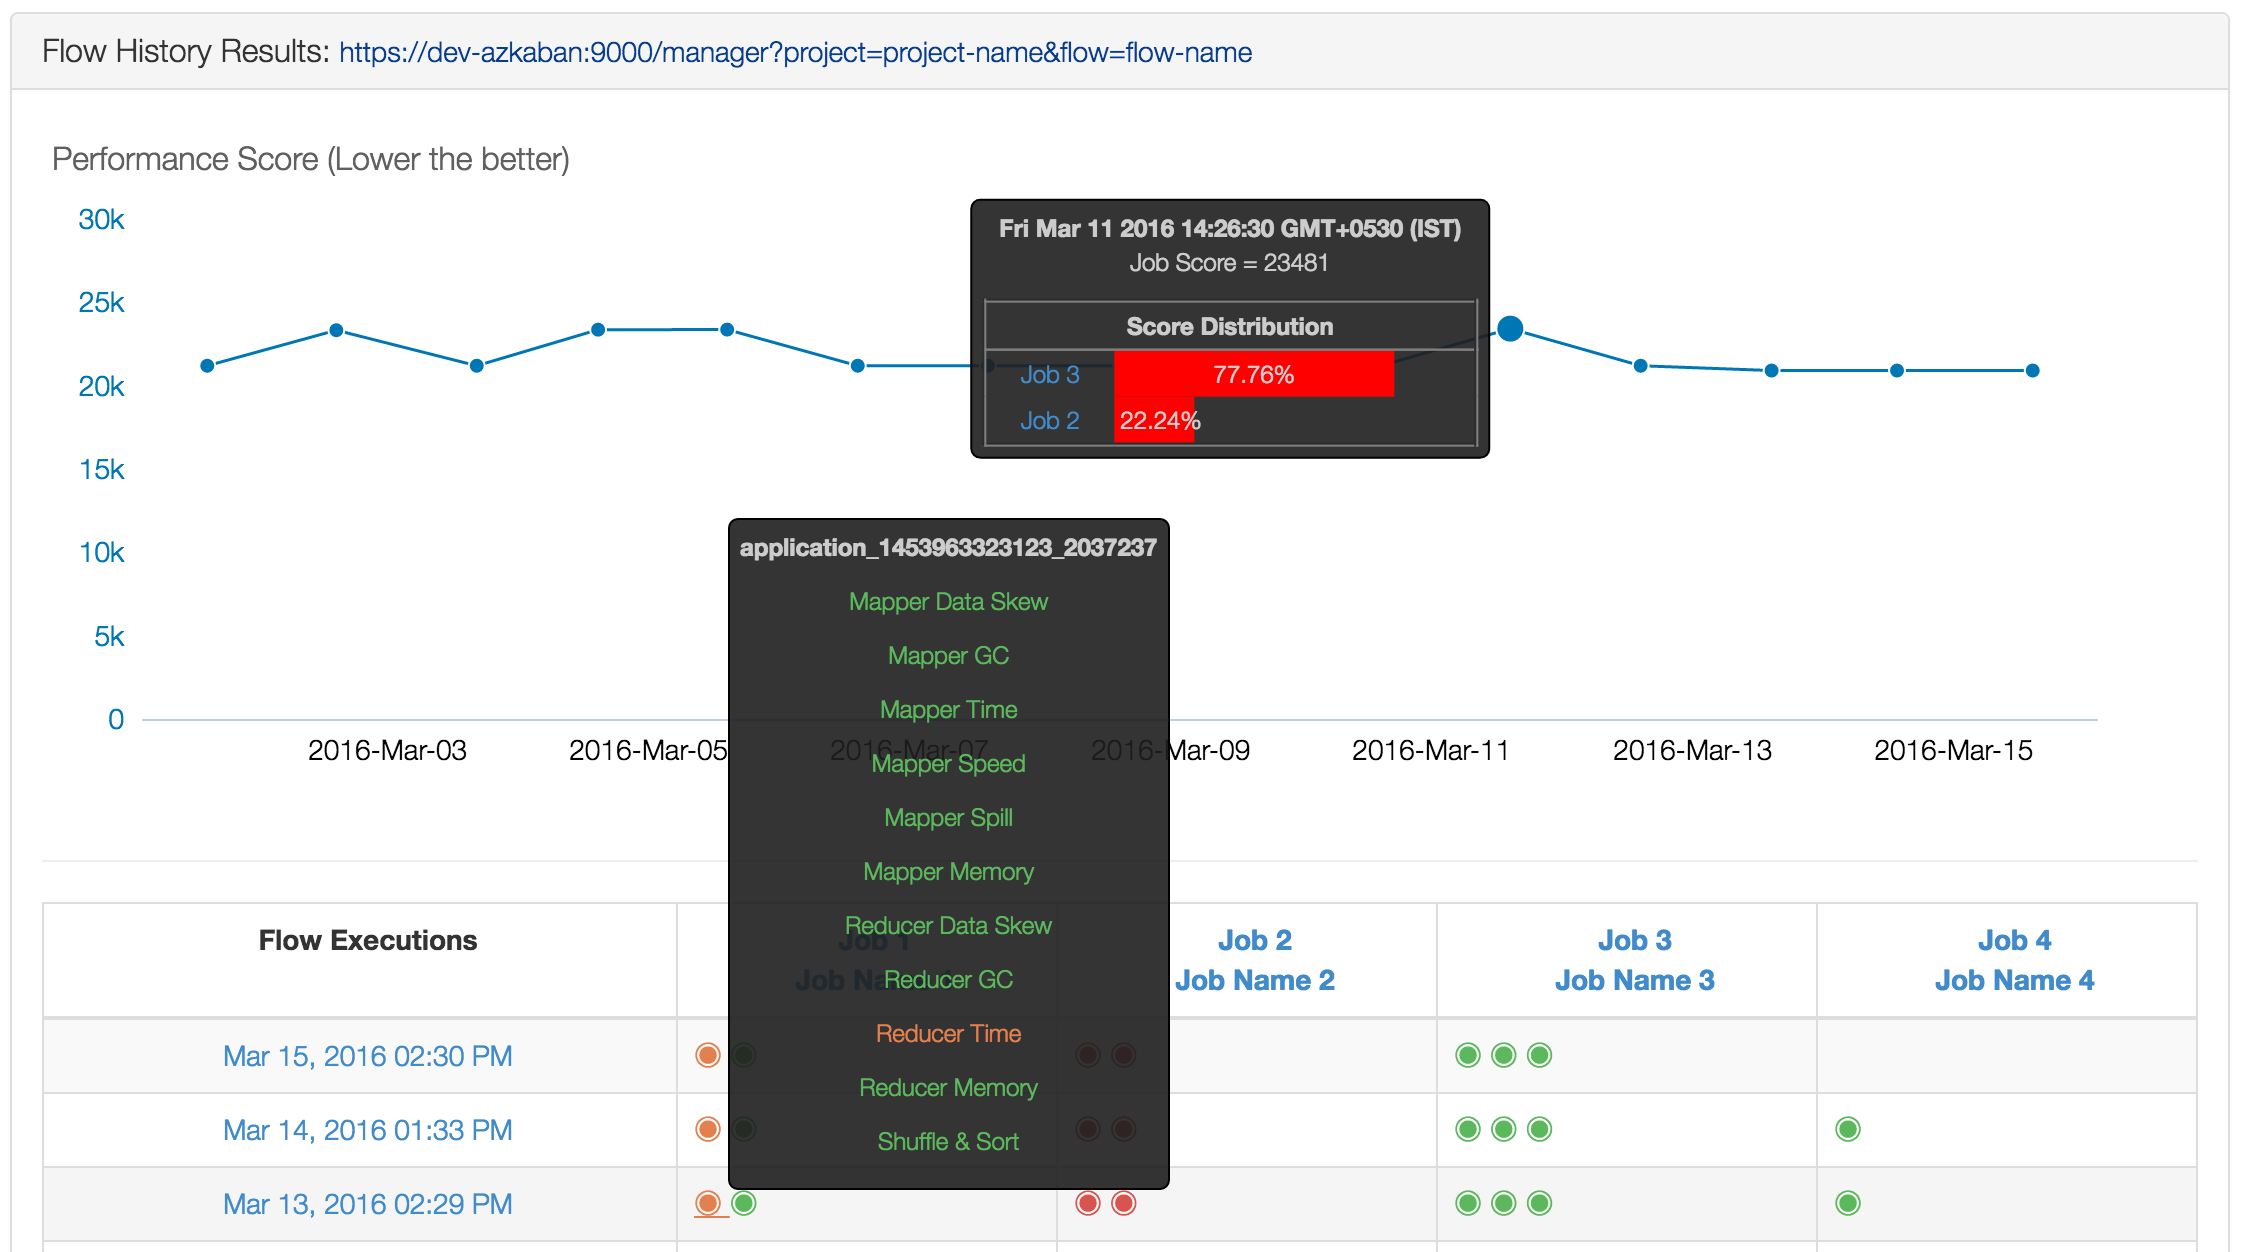
针对单个 job 还可以看到 performance 的历史曲线图。
优化建议。
2. 系统架构
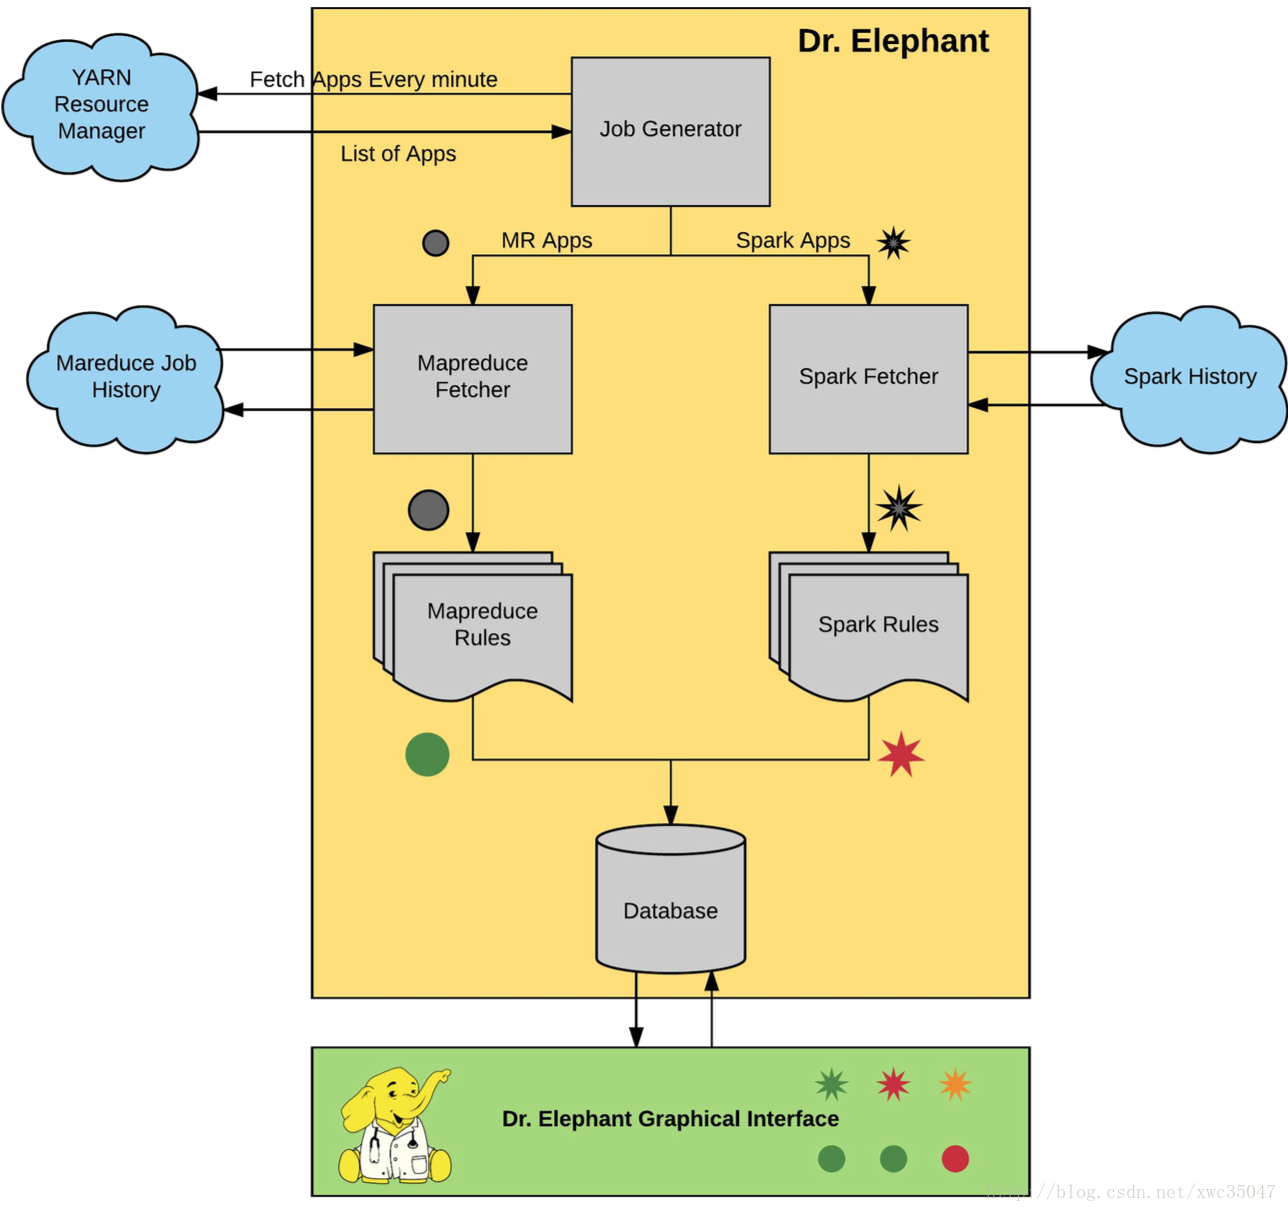
Dr. Elephant 的系统架构如下图。主要包括三个部分:
- 数据采集:数据源为 Job History
- 诊断和建议:内置诊断系统
- 存储和展示:MySQL 和 WebUI
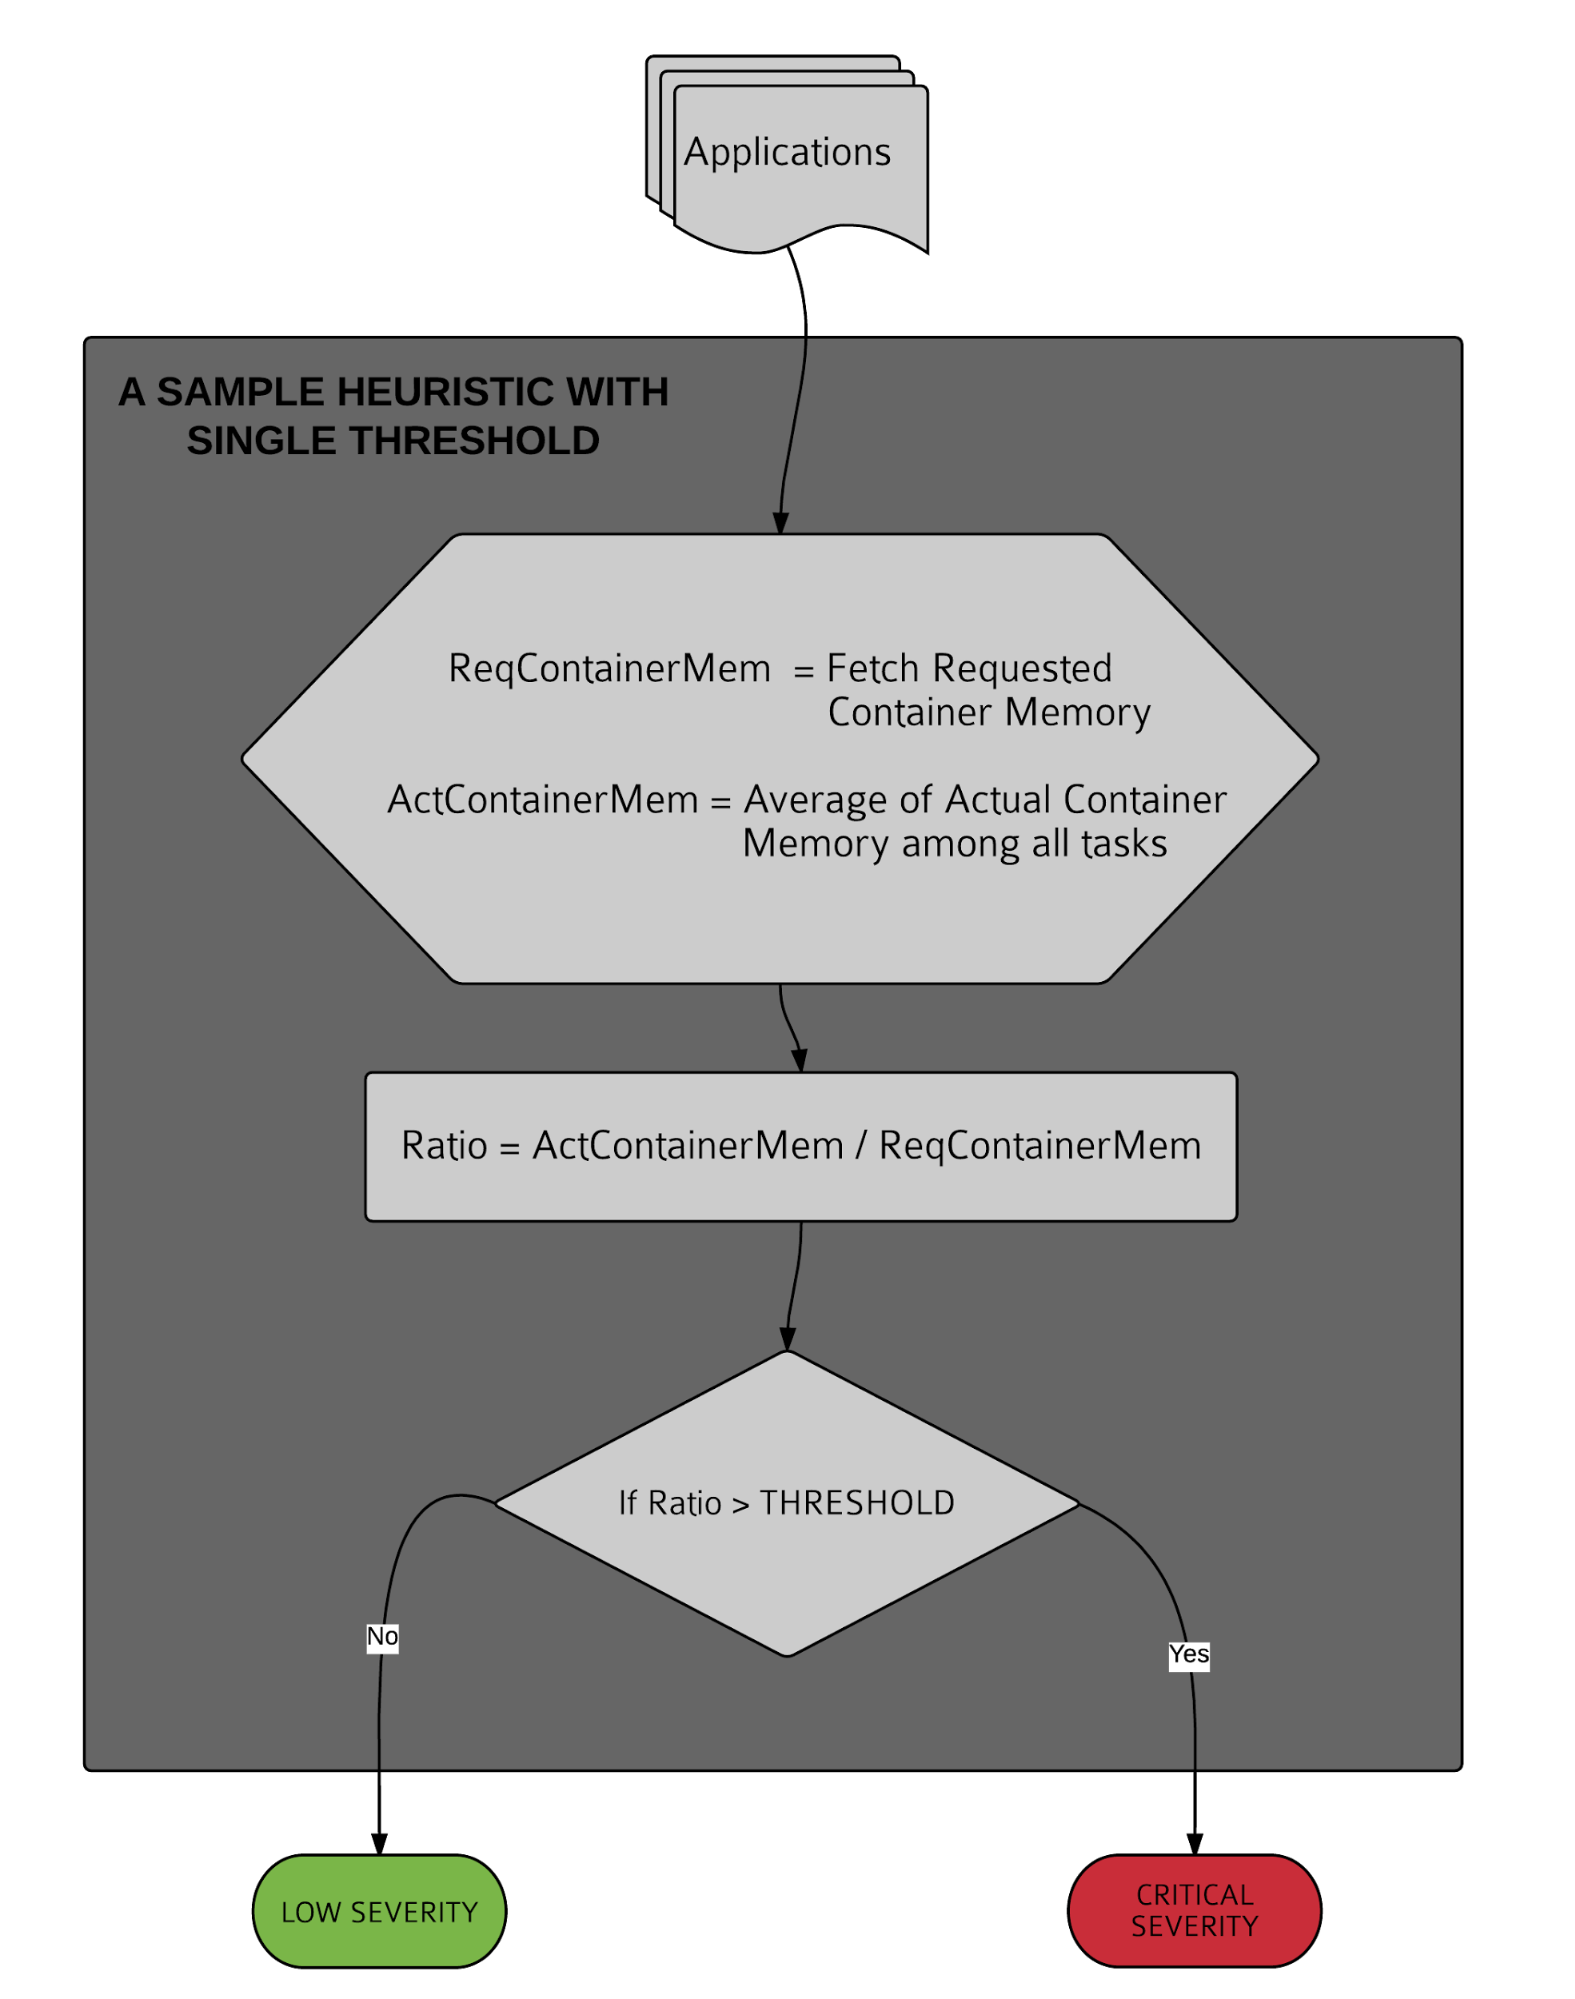
3. 启发式算法
启发式算法也就是诊断规则,是 Dr.Elephant 的核心部分。工作流程如下:
- 获取数据
- 量化计算得到一个得分值
- 将分值与不同诊断等级阈值进行比较
下面简单介绍 Dr. Elephant 使用的规则:1~11 是 mapreduce job,剩下的是 spark 相关。
Mapper 数据倾斜
Mapper 作业中的数据可能会发生数据倾斜,这条规则就是用来检测是否发生数据倾斜。方法:将所有的 Mapper 分成两部分,然后比较这两部分的 task 数目以及其他一些相关的数据。具体的计算过程如下。
1
2
3
4
5
6
7
8
9
10
11
12
13
14
15
16
17
18
19
20
21
22
23
24
25
26
27
28
29
30
31
32
33
34
Let us define the following variables,
deviation: the deviation in input bytes between two groups
num_of_tasks: the number of map tasks
file_size: the average input size of the larger group
num_tasks_severity: List of severity thresholds for the number of tasks. e.g., num_tasks_severity = {10, 20, 50, 100}
deviation_severity: List of severity threshold values for the deviation of input bytes between two groups. e.g., deviation_severity: {2, 4, 8, 16}
files_severity: The severity threshold values for the fraction of HDFS block size. e.g. files_severity = { ⅛, ¼, ½, 1}
Let us define the following functions,
func avg(x): returns the average of a list x
func len(x): returns the length of a list x
func min(x,y): returns minimum of x and y
func getSeverity(x,y): Compares value x with severity threshold values in y and returns the severity.
We’ll compute two groups recursively based on average memory consumed by them.
Let us call the two groups: group_1 and group_2
Without loss of generality, let us assume that,
avg(group_1) > avg(group_2) and len(group_1)< len(group_2) then,
deviation = avg(group_1) - avg(group_2) / min(avg(group_1)) - avg(group_2))
file_size = avg(group_1)
num_of_tasks = len(group_0)
The overall severity of the heuristic can be computed as,
severity = min(
getSeverity(deviation, deviation_severity)
, getSeverity(file_size,files_severity)
, getSeverity(num_of_tasks,num_tasks_severity)
)
Mapper GC
分析 job 的 GC 效率,也就是 GC 时间占所有 CPU 时间的比例,然后定义不同的等级。具体的计算过程如下。
1
2
3
4
5
6
7
8
9
10
11
12
13
14
15
16
17
18
Let us define the following variables:
avg_gc_time: average time spent garbage collecting
avg_cpu_time: average cpu time of all the tasks
avg_runtime: average runtime of all the tasks
gc_cpu_ratio: avg_gc_time/ avg_cpu_time
gc_ratio_severity: List of severity threshold values for the ratio of avg_gc_time to avg_cpu_time.
runtime_severity: List of severity threshold values for the avg_runtime.
Let us define the following functions,
func min(x,y): returns minimum of x and y
func getSeverity(x,y): Compares value x with severity threshold values in y and returns the severity.
The overall severity of the heuristic can then be computed as,
severity = min(getSeverity(avg_runtime, runtime_severity), getSeverity(gc_cpu_ratio, gc_ratio_severity)
Mapper Memory
分析 mapper 的内存使用情况。计算方法:task 消耗内存 / container 内存。task 消耗内存是每一个 task 占用的最大内存的平均值,container 内存是配置 mapreduce.map/reduce.memory.mb 配置的。具体的计算过程如下。
1
2
3
4
5
6
7
8
9
10
11
12
13
14
15
16
17
18
Let us define the following variables,
avg_physical_memory: Average of the physical memories of all tasks.
container_memory: Container memory
container_memory_severity: List of threshold values for the average container memory of the tasks.
memory_ratio_severity: List of threshold values for the ratio of avg_plysical_memory to container_memory
Let us define the following functions,
func min(x,y): returns minimum of x and y
func getSeverity(x,y): Compares value x with severity threshold values in y and returns the severity.
The overall severity can then be computed as,
severity = min(getSeverity(avg_physical_memory/container_memory, memory_ratio_severity)
, getSeverity(container_memory,container_memory_severity)
)
Mapper Speed
分析 mapper 代码的运行效率,并找到受限的资源瓶颈,比如 CPU,或者处理的数据量太大。计算过程如下。
1
2
3
4
5
6
7
8
9
10
11
12
13
14
15
16
17
Let us define the following variables,
median_speed: median of speeds of all the mappers. The speeds of mappers are found by taking the ratio of input bytes to runtime.
median_size: median of size of all the mappers
median_runtime: median of runtime of all the mappers.
disk_speed_severity: List of threshold values for the median_speed.
runtime_severity: List of severity threshold values for median_runtime.
Let us define the following functions,
func min(x,y): returns minimum of x and y
func getSeverity(x,y): Compares value x with severity threshold values in y and returns the severity.
The overall severity of the heuristic can then be computed as,
severity = min(getSeverity(median_speed, disk_speed_severity), getSeverity(median_runtime, median_runtime_severity)Mapper Time
通过 mapper 的运行时间来分析 mapper 的数量是否合适。当出现下面俩种情况时就需要优化了。
- mapper 运行时间很短,可能原因
- mapper 数量过多
- mapper 平均运行时间很短
- 文件 size 较小
- 大文件块,可能原因
- mapper 数量很少
- mapper 平均运行时间很长
- 文件大小过大 (达 GB 级别)
计算过程如下
1
2
3
4
5
6
7
8
9
10
11
12
13
14
15
16
17
18
19
Let us define the following variables,
avg_size: average size of input data for all the mappers
avg_time: average of runtime of all the tasks.
num_tasks: total number of tasks.
short_runtime_severity: The list of threshold values for tasks with short runtime
long_runtime_severity: The list of threshold values for tasks with long runtime.
num_tasks_severity: The list of threshold values for number of tasks.
Let us define the following functions,
func min(x,y): returns minimum of x and y
func getSeverity(x,y): Compares value x with severity threshold values in y and returns the severity.
The overall severity of the heuristic can then be computed as,
short_task_severity = min(getSeverity(avg_time,short_runtime_severity), getSeverity(num_tasks, num_tasks_severity))
severity = max(getSeverity(avg_size, long_runtime_severity), short_task_severity)
- mapper 运行时间很短,可能原因
Mapper Spill
Mapper spill 从磁盘 IO 的角度去评测 mapper 的性能。spill ratio (spilled records/output records) 是衡量 mapper 性能的一个很关键的指标:如果值接近 2,表示几乎每个记录都 spill 了,被写到磁盘两次。这时候一般都是因为 mapper 的输出太大了。计算过程如下。
1
2
3
4
5
6
7
8
9
10
11
12
13
14
15
16
17
18
Let us define the following parameters,
total_spills: The sum of spills from all the map tasks.
total_output_records: The sum of output records from all the map tasks.
num_tasks: Total number of tasks.
ratio_spills: total_spills/ total_output_records
spill_severity: List of the threshold values for ratio_spills
num_tasks_severity: List of threshold values for total number of tasks.
Let us define the following functions,
func min(x,y): returns minimum of x and y
func getSeverity(x,y): Compares value x with severity threshold values in y and returns the severity.
The overall severity of the heuristic can then be computed as,
severity = min(getSeverity(ratio_spills, spill_severity), getSeverity(num_tasks, num_tasks_severity)
Reducer Data Skew
类似 mapper data skew
Reducer GC
类似 mapper gc
Reducer Memory
类似 mapper memory
Reducer Time
类似 mapper time,分析 reducer 的执行效率,可以帮助我们更好的配置 job 中 reducer 的数量。
Shuffle and Sort
可以分析 shuffle 和 sort 过程的执行时间在整个 task 的 reducer 执行期间的占比,从而反映出 reducer 的执行效率。计算方法
1
2
3
4
5
6
7
8
9
10
11
12
13
14
15
16
17
18
Let’s define following variables,
avg_exec_time: average time spent in execution by all the tasks.
avg_shuffle_time: average time spent in shuffling.
avg_sort_time: average time spent in sorting.
runtime_ratio_severity: List of threshold values for the ratio of twice of average shuffle or sort time to average execution time.
runtime_severity: List of threshold values for the runtime for shuffle or sort stages.
The overall severity can then be found as,
severity = max(shuffle_severity, sort_severity)
where shuffle_severity and sort_severity can be found as:
shuffle_severity = min(getSeverity(avg_shuffle_time, runtime_severity), getSeverity(avg_shuffle_time*2/avg_exec_time, runtime_ratio_severity))
sort_severity = min(getSeverity(avg_sort_time, runtime_severity), getSeverity(avg_sort_time*2/avg_exec_time, runtime_ratio_severity))Spark Event Log Limit
为了处理方便,Dr.Elephant 将 spark event log 的最大设置为 100 M。如果日志超过限制,会使用另一个进程处理。
Spark Executor Load Balance
和 MapReduce 任务的执行机制不同,Spark 应用在启动后会一次性分配它所需要的所有资源,直到整个任务结束才会释放这些资源。优化 spark 处理器的负载均衡就比较重要,可以避免对集群的过度使用。计算过程如下。
1
2
3
4
5
6
7
8
9
10
11
12
13
14
15
16
17
18
19
20
21
22
23
24
25
26
27
28
29
Let us define the following variables:
peak_memory: List of peak memories for all executors
durations: List of durations of all executors
inputBytes: List of input bytes of all executors
outputBytes: List of output bytes of all executors.
looser_metric_deviation_severity: List of threshold values for deviation severity, loose bounds.
metric_deviation_severity: List of threshold values for deviation severity, tight bounds.
Let us define the following functions:
func getDeviation(x): returns max(|maximum-avg|, |minimum-avg|)/avg, where
x = list of values
maximum = maximum of values in x
minimum = minimum of values in x
avg = average of values in x
func getSeverity(x,y): Compares value x with severity threshold values in y and returns the severity.
func max(x,y): returns the maximum value of x and y.
func Min(l): returns the minimum of a list l.
The overall severity can be found as,
severity = Min( getSeverity(getDeviation(peak_memory), looser_metric_deviation_severity),
getSeverity(getDeviation(durations), metric_deviation_severity),
getSeverity(getDeviation(inputBytes), metric_deviation_severity),
getSeverity(getDeviation(outputBytes), looser_metric_deviation_severity).
)Spark Job Runtime
优化 Spark job 的运行时间。一个 Spark 应用可以拆分成多个 job,每个 Job 又可以拆分成多个 stage。计算过程如下
1
2
3
4
5
6
7
8
9
10
11
12
13
14
15
16
17
Let us define the following variables,
avg_job_failure_rate: Average job failure rate
avg_job_failure_rate_severity: List of threshold values for average job failure rate
Let us define the following variables for each job,
single_job_failure_rate: Failure rate of a single job
single_job_failure_rate_severity: List of threshold values for single job failure rate.
The severity of the job can be found as maximum of single_job_failure_rate_severity for all jobs and avg_job_failure_rate_severity.
i.e. severity = max(getSeverity(single_job_failure_rate, single_job_failure_rate_severity),
getSeverity(avg_job_failure_rate, avg_job_failure_rate_severity)
)
where single_job_failure_rate is computed for all the jobs.
Spark Memory Limit
目前 Spark 应用还不能进行动态资源分配。MapReduce任务在运行时,能够为每个map/reduce进程分配所需要的资源,并且在执行过程中逐步释放占用的资源。而Spark在应用程序执行时,会一次性的申请所需要的所有资源,直到任务结束才释放这些资源。过多的内存使用会对集群节点的稳定性产生影响。所以,我们需要限制Spark应用程序能使用的最大内存比例。计算过程如下
1
2
3
4
5
6
7
8
9
10
11
12
13
14
15
16
17
18
19
20
Let us define the following variables,
total_executor_memory: total memory of all the executors
total_storage_memory: total memory allocated for storage by all the executors
total_driver_memory: total driver memory allocated
peak_memory: total memory used at peak
mem_utilization_severity: The list of threshold values for the memory utilization.
total_memory_severity_in_tb: The list of threshold values for total memory.
Let us define the following functions,
func max(x,y): Returns maximum of x and y.
func getSeverity(x,y): Compares value x with severity threshold values in y and returns the severity.
The overall severity can then be computed as,
severity = max(getSeverity(total_executor_memory,total_memory_severity_in_tb),
getSeverity(peak_memory/total_storage_memory, mem_utilization_severity)
)Spark Stage Runtime
类似 Spark Job Runtime,一个 Spark 应用可以拆分成多个 job,每个 job 可以拆分成多个 stage。计算过程如下。
1
2
3
4
5
6
7
8
9
10
11
12
13
14
15
16
17
18
19
20
21
22
23
24
25
26
27
28
Let us define the following variable for each spark job,
stage_failure_rate: The stage failure rate of the job
stagge_failure_rate_severity: The list of threshold values for stage failure rate.
Let us define the following variables for each stage of a spark job,
task_failure_rate: The task failure rate of the stage
runtime: The runtime of a single stage
single_stage_tasks_failure_rate_severity: The list of threshold values for task failure of a stage
stage_runtime_severity_in_min: The list of threshold values for stage runtime.
Let us define the following functions,
func max(x,y): returns the maximum value of x and y.
func getSeverity(x,y): Compares value x with severity threshold values in y and returns the severity.
The overall severity can be found as:
severity_stage = max(getSeverity(task_failure_rate, single_stage_tasks_faioure_rate_severity),
getSeverity(runtime, stage_runtime_severity_in_min)
)
severity_job = getSeverity(stage_failure_rate,stage_failure_rate_severity)
severity = max(severity_stage, severity_job)
where task_failure_rate is computed for all the tasks.
4. 启发式算法代码组织
每个规则都是配置在配置文件中。
1 | <heuristic> |
规则的具体实现在 classname 里面,实现方式是基于一个基类,然后实现指定的接口,比如载入阈值参数(因为是有多个等级,所以参数有多个)等。这么做的好处在于:
- 不用将所有规则高度抽象成统一的模型,然后使用规则引擎来做
- 阈值是配置在配置文件中的,也可以实现规则的热更新
算法实现代码可以参考:com.linkedin.drelephant.mapreduce.heuristics 和 com.linkedin.drelephant.spark.heuristics 。
5.优化建议
下面是一些常规优化建议。
1. Tuning Each Step is Important
对于Pig任务来说,如果使用默认参数来设置reducer的数量,这对任务的性能可能是致命的。一般来说,对每个Pig任务,都花一些时间来调优参数PARALLEL是非常值得做的。例如:
1 | memberFeaturesGrouped = GROUP memberFeatures BY memberId PARALLEL 90; |
2. File Count vs. Block Count
由于 NameNode 的内存中要保存文件的 metadata,所以大文件要优于小文件。
3. Java Task Memory Management
map/reduce task 默认会分配 2G 内存。对于 Java job,2G 内存会被拆分为 1G heap 和 0.5 ~ 1G non-heap。然而这对于某些 job 来说并不是足够的。下面是一些能够减少内存使用的技巧。
UseCompressedOops
32 系统的 JVM 使用 32bit 的无符号整型来定位内存区域,最大可表示的堆空间为 2^32 ,也就是 4G。64 位的 JVM 使用 64bit 的无符号 long 型来表示内存位置,最大可以表示的内存堆大小为 2^64。使用 long 代替 int,导致需要的内存增大。最新的 JVM 支持在使用时添加选项 CompressedOops,在一些情况下使用 32bit 的空间代替 64bit 空间来保存内存定位信息,这样也可以在一定程度上减少内存的使用。添加设置
1 | Hadoop-inject.mapreduce.(map|reduce).java.opts=-Xmx1G -XX:+UseCompressedOops |
UseCompressedStrings
这样会将 String 类型转换为压缩的 byte[] 型。如果 String 类型变量使用的比较多,这样会节省非常多的内存。设置:添加 -XX:+UseCompressedStrings 到配置项 mapreduce.(map|reduce).java.opts。
下面是一些重要的调优参数。
1. Mapper 相关
mapreduce.input.fileinputformat.split.minsize
map 输入的文件块的大小的最小值。增加这个参数的值就可以减少 mapper 的数量。
mapreduce.input.fileinputformat.split.maxsize
当使用 CombineFileInputFormat 或者 MultiFileInputFormat 时,map 输入的文件块的大小的最大值。相应的,缩小这个参数值就可以增加 mapper 的数量。值得注意的是,如果使用 CombineFileInputFormat 时,不设置最大的 split 大小,那么你的 job 会只使用一个 mapper。
2. Reducer 相关
mapreduce.job.reduces
对工作流性能影响最大的一个因素就是 reducer 的数量。reducer 数量过少导致 task 执行时间过长;数量过多同样会导致问题。reducer 数量调整不是一个简单的事儿,下面是一些建议:
- reducer 数量多意味着 NameNode 上更多的文件。过多的文件可能造成 NameNode 挂掉。如果 reduce 的输出小于 512M 时,尽量使用较少的 reducer。
- reducer 数量多意味着每个 reducer 处理数据的时间更短。如果使用的reducer数量过少,每个reducer作业消耗的时间会显著增加。reducer运行速度变快,就能处理更多的任务。
mapreduce.job.reduce.slowstart.completedmaps
这个参数是 reducer 开始执行前,至少有多少比例的 mapper 必须执行结束,默认值是 80%。但是 对于很多特定的 job,80% 不是最好的。下面是一些参数调整的参考。
- 每个 reducer 接收数据多少
- 剩下的 map 需要花费的时间
如果 map 的输出数据量比较大,一般建议 reducer 提前开始执行以处理数据;反之 reducer 可以稍晚执行。一个估算的方法是先计算 shuffle 时间:所有的 map 执行完到第一个 reduce 开始执行中间的时间,然后 reducers 比较理想的执行时间是最后一个 map 结束时间减去 shuffle 时间。
3. Compression
mapreduce.map.output.compress
将该参数设置为 True 可以将 map 输出的数据进行压缩,从而可以减少节点之间的数据传输量。然而需要注意的是压缩和解压的时间要小于数据在节点之间的传输时间。如果 map 输出数据量很大,或者属于比较容易压缩的类型,这个参数设置为 True 则很有必要;反之设置为 False 则可以减少 CPU 的工作量。
4. Memory
mapreduce.(map|reduce).memory.mb
默认 2G,1G heap + 0.5~1G non-heap。一些情况下这个内存大小是不够用的。
5. Advanced
controlling the number of spills / io.sort.record.percent
mapreduce.(map|reduce).speculative
将这个参数设置为 false 可以避免相同的 map 或者 reduce task 并发执行。
还有一些是 Pig 和 Hive 相关的,这里就不再一一说明了。
6. 值得借鉴的地方
Dr. Elephant 非常的简洁,我觉得我们可以借鉴几点的是:
- 数据采集
- 诊断规则
- 优化建议
- UI 展示